Your harness is the other half of the model
One GH200 now serves text, vision, speech and a safety model. The interesting part is not that it fits. It is what had to stop being true first.
Every number here was measured on one machine and checked against a primary source.
One card. Four jobs. A router in front.
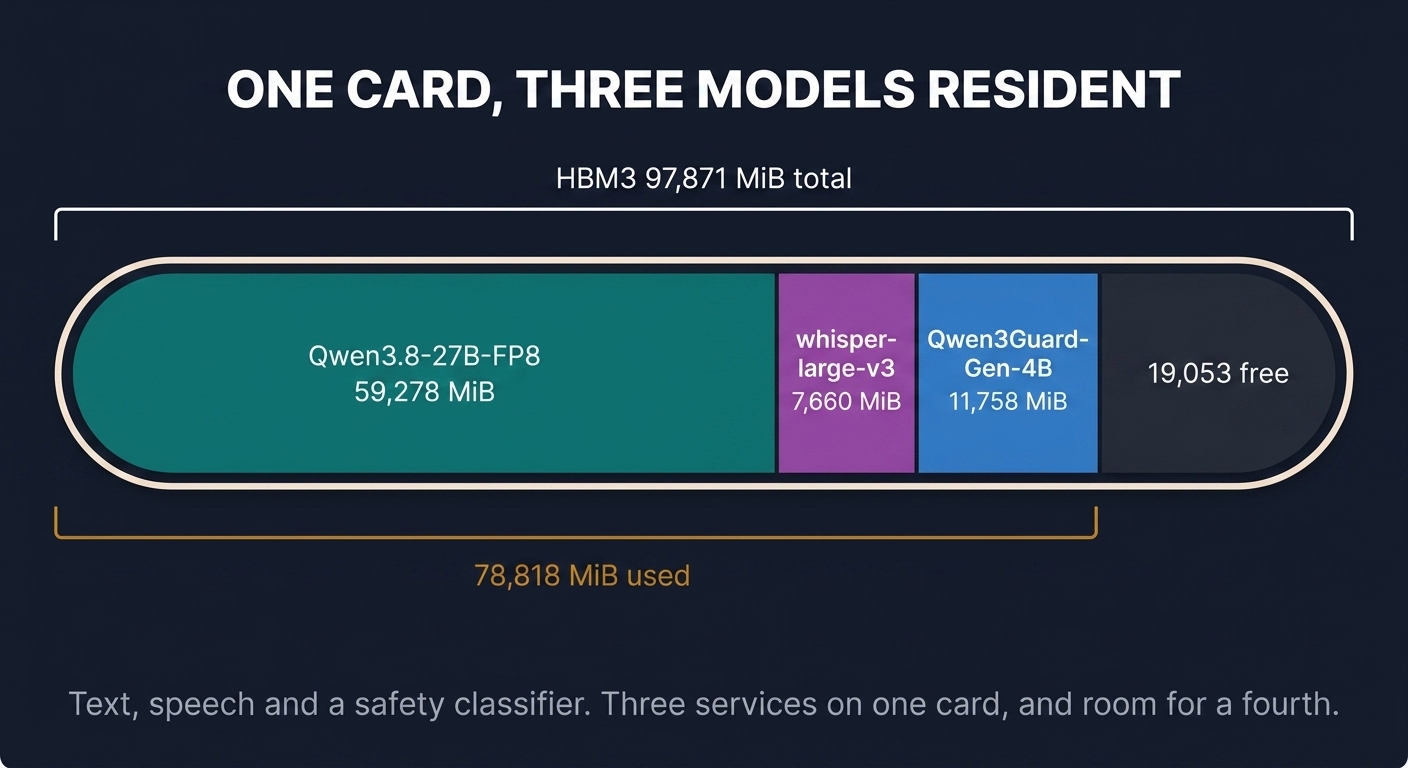
Claude Code drives the text tier over its own native protocol. None of this was affordable twelve hours earlier, and the hardware did not change. A constraint I had accepted without re-testing did. Here is how it is wired.
Two machines, and one link that does the work
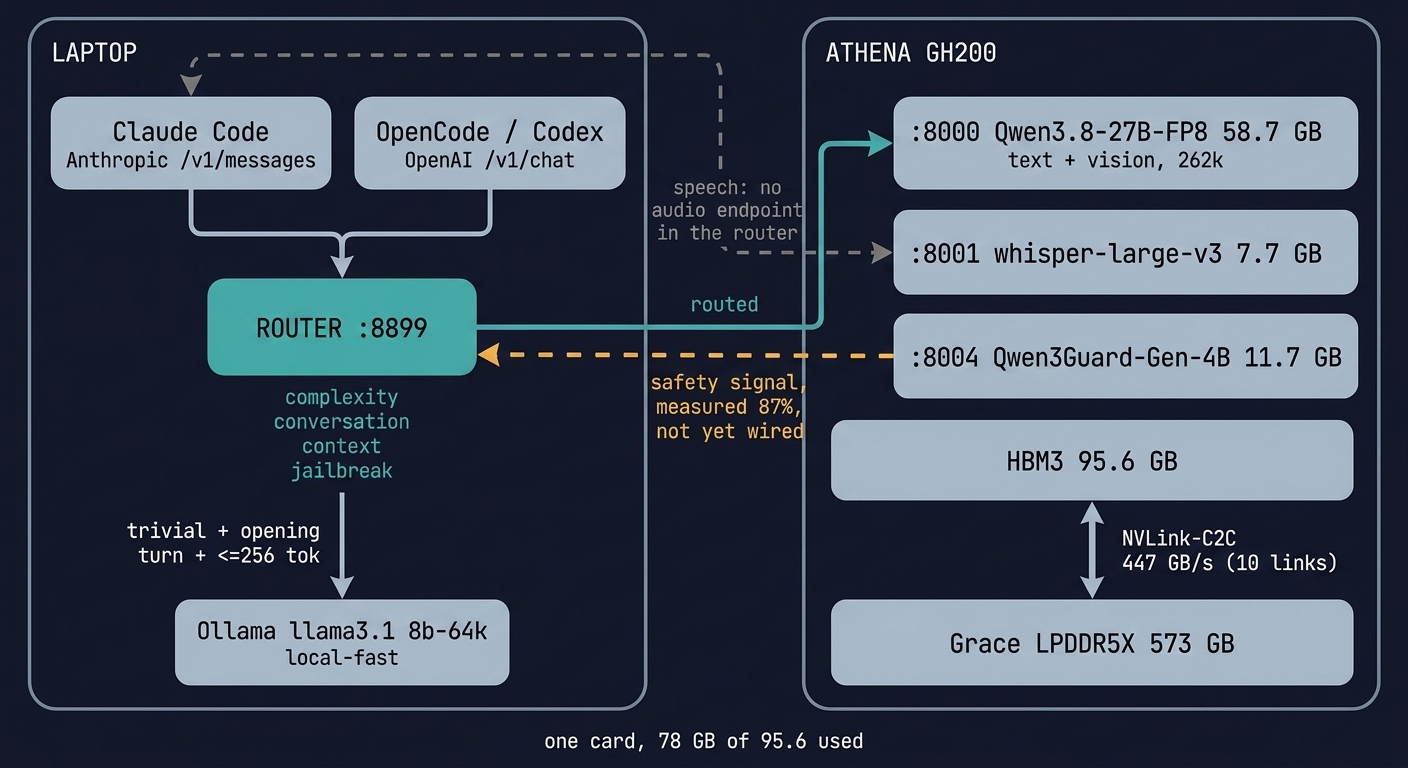
Do not absorb it all now. Every box gets its own slide later. A turn goes local only if all three signals agree: trivial, opening turn, under 256 tokens. Everything else crosses to Athena. One of these signals is unlike the others. The jailbreak route does not pick a model at all, it takes the tools away, so an injection arrives as inert text. Free and blunt, sitting next to a semantic signal that needed calibrating to 0.07 for 75 percent accuracy. Speech stays outside the router deliberately: the string "transcription" appears zero times in its source.
One GH200, sitting in a rack
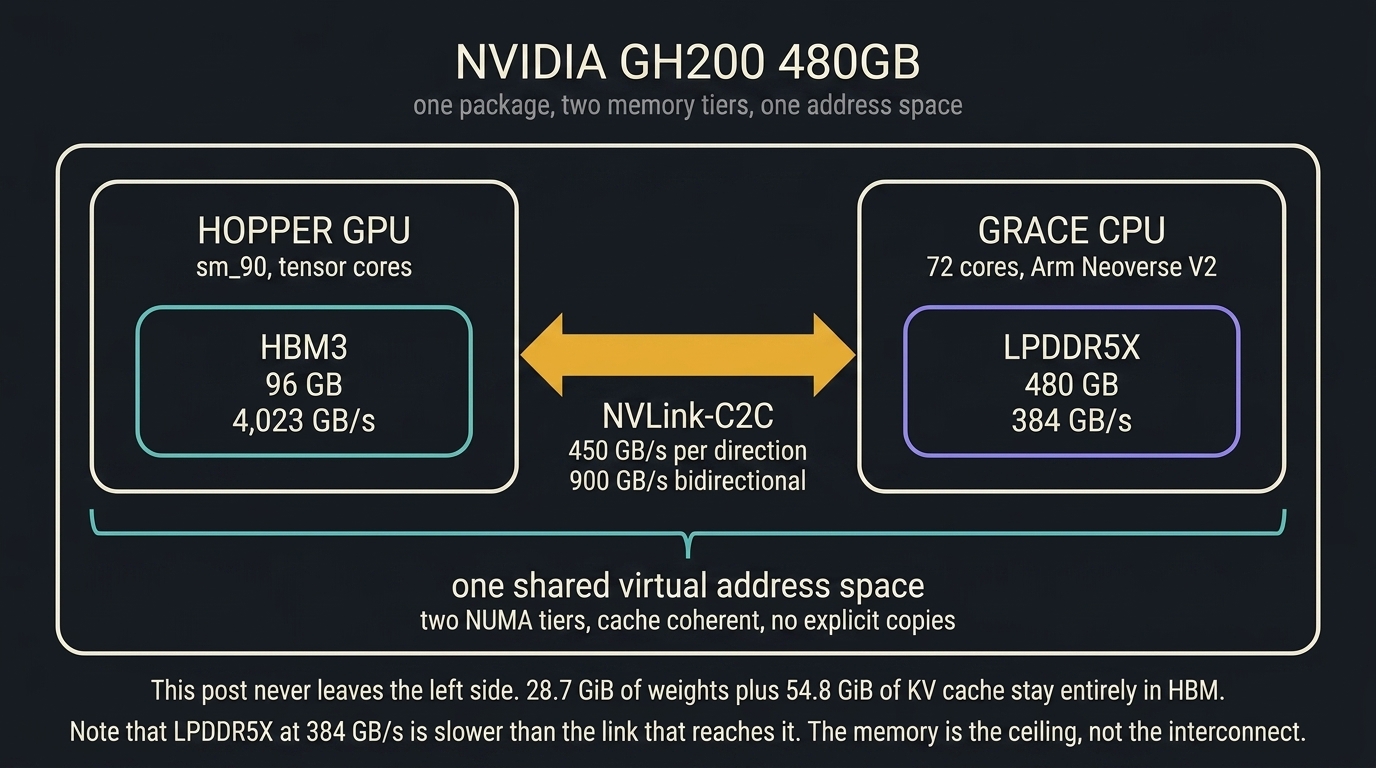
One address space across two memory tiers. For everything in this talk the workload never leaves the left half, so you can forget the Grace side exists. This is a story about software.
Every request runs in two completely different phases
Five slides of foundations, about four minutes. If you serve models for a living, this is review and you can rest. If you mostly call APIs, this is the part that makes everything after it land. I would rather over-explain than have half the room politely lost.
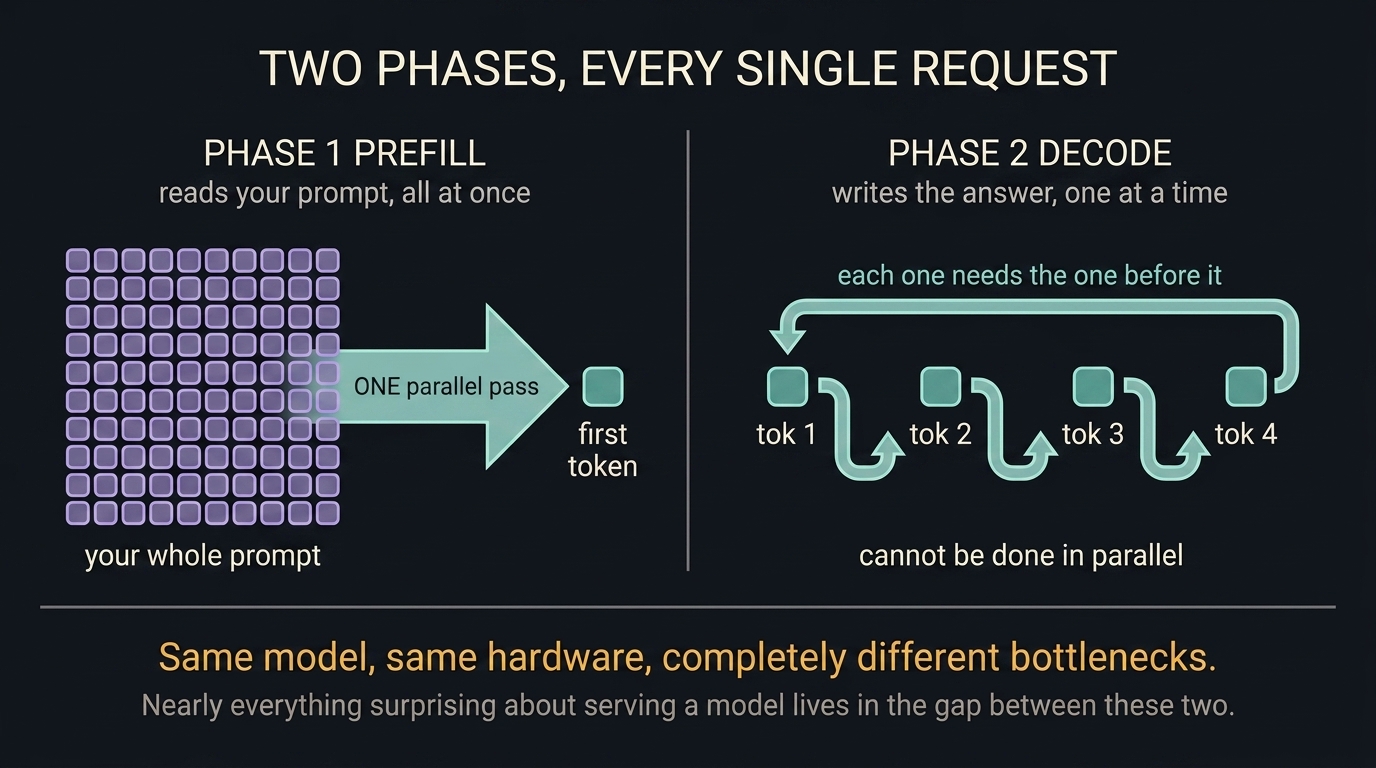
Almost everything surprising about serving a model lives in the gap between those two phases. Hold on to this, the whole talk hangs off it.
To produce one token, the GPU reads the entire model
Not part of it. All of it. Every weight, out of memory, for every single token. Then it does it again for the next one.
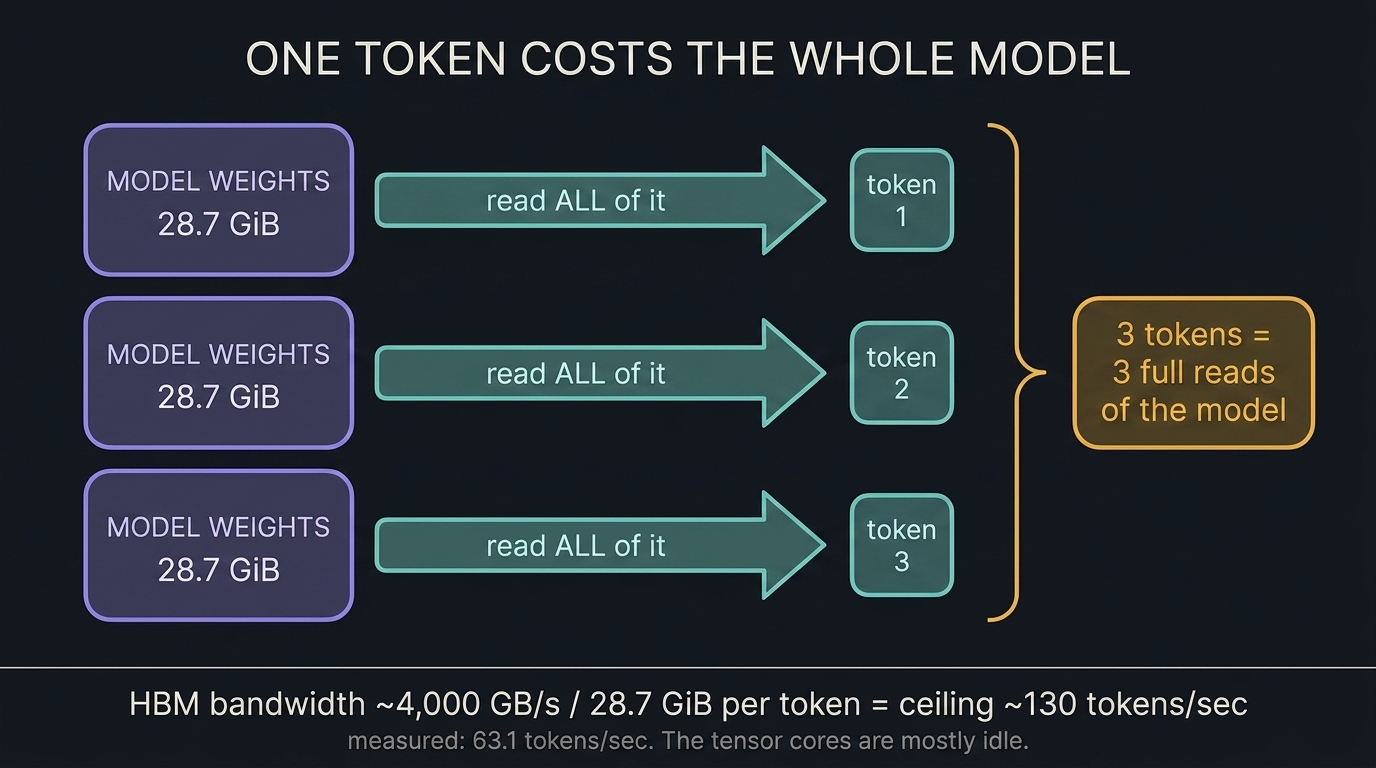
So single-stream generation is not limited by how fast the GPU can do maths. It is limited by how fast it can move bytes. The tensor cores, the expensive part you actually bought the card for, sit mostly idle.
Prefill is the opposite: one pass over a huge batch of tokens, math units saturated. Same silicon, opposite bottleneck.
Why context costs you memory
When the model generates token 5,000, attention makes it look back at all 4,999 tokens before it. Recomputing those every step would be brutally quadratic.
So the server keeps a KV cache: for every token that has passed through, it stores that token's keys and values, once, and reuses them forever after.
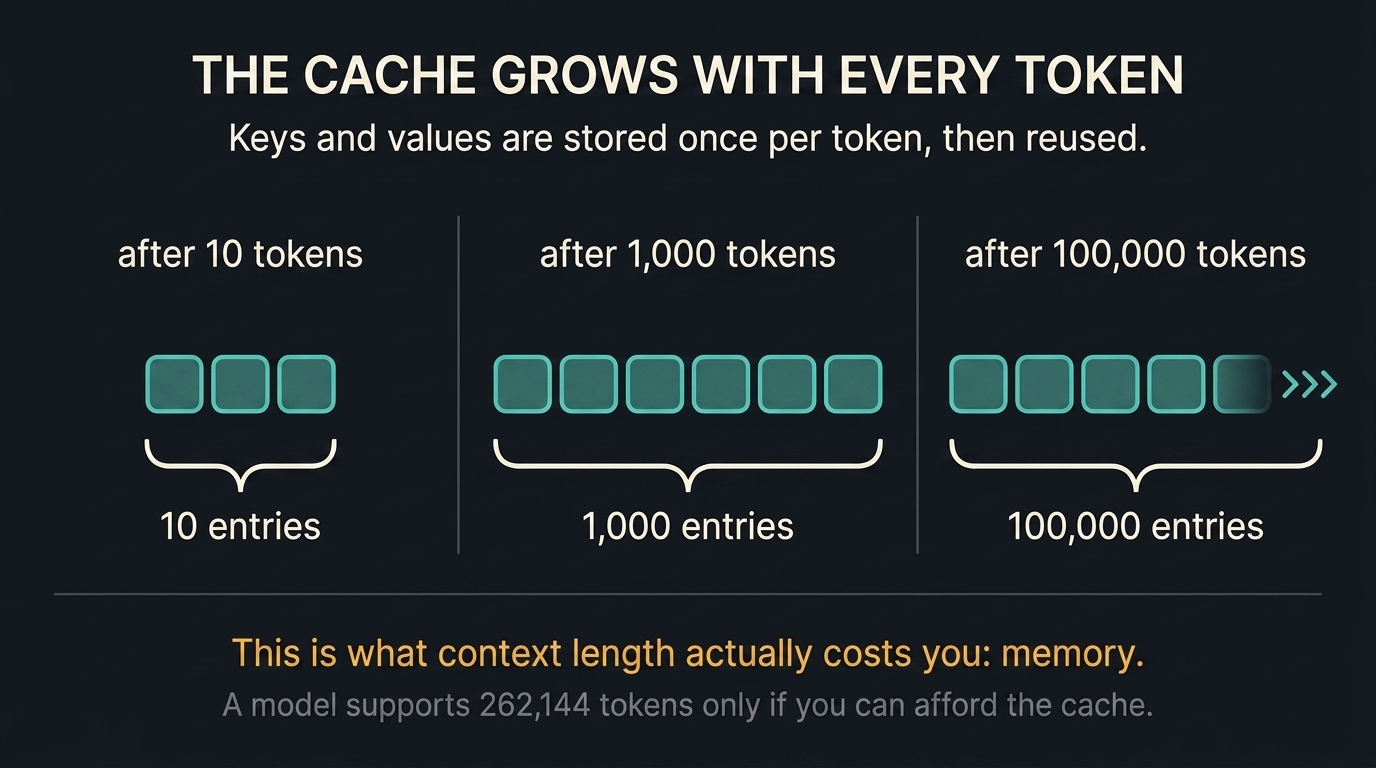
The win is that each token is processed once rather than once per subsequent step. The cost is that the cache grows with every token. When someone says a model "supports 262k context," what they mean is: if you can afford the cache.
So what is actually in that cache?
Attention works by each token asking a question. That question is a query. Every earlier token offers a key, saying roughly what it is about, and a value, carrying its actual content. Models run a couple of dozen of these comparisons in parallel, and each parallel copy is called a head. Only the keys and values get cached, and they do not have to be one set per head.
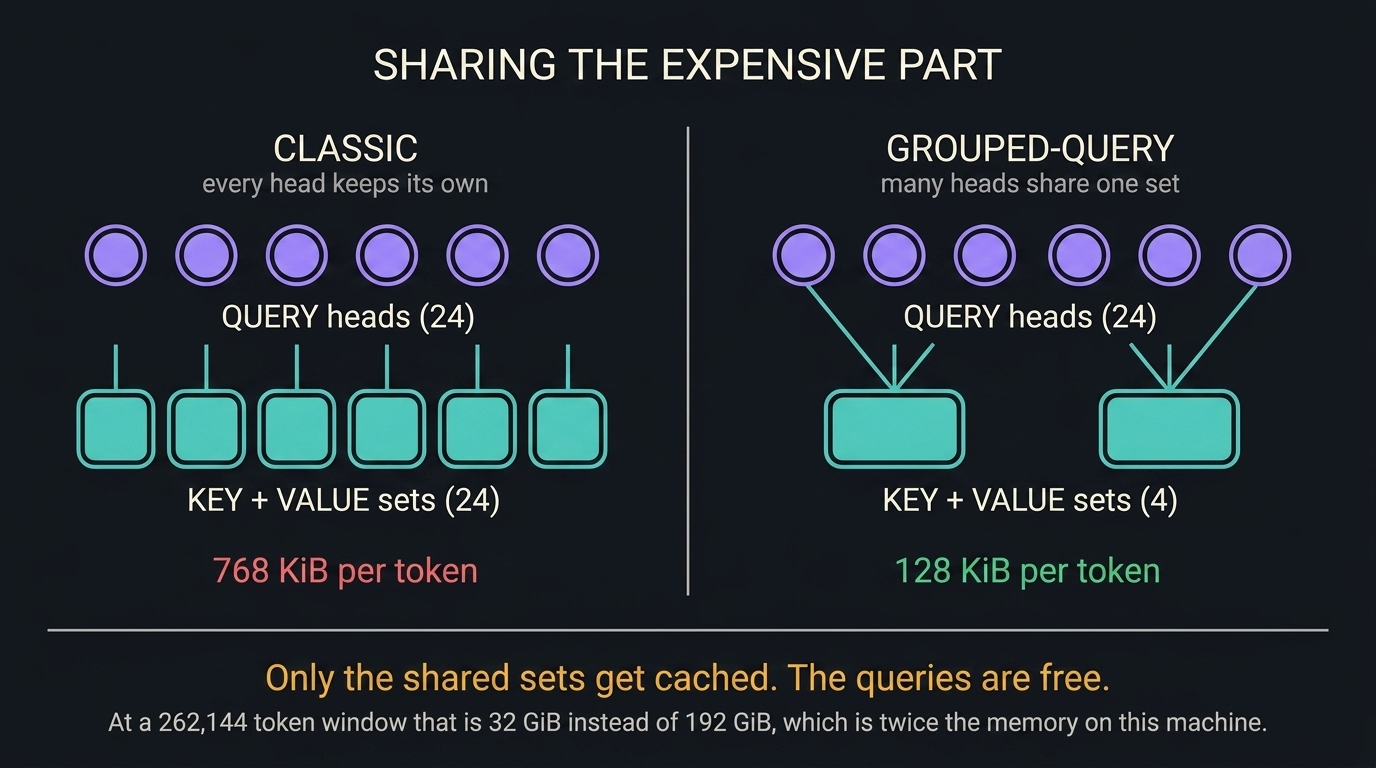
That is grouped-query attention, and it is the only reason a 262k window fits on this box at all. Your context length is an architecture decision, not a hardware capability.
The two things everyone tunes
Quantization stores each weight in fewer bits. FP8 instead of BF16 halves the bytes, and since decode is bandwidth bound, fewer bytes per weight is directly fewer bytes to read per token. Speculative decoding attacks the same bottleneck from the other end:
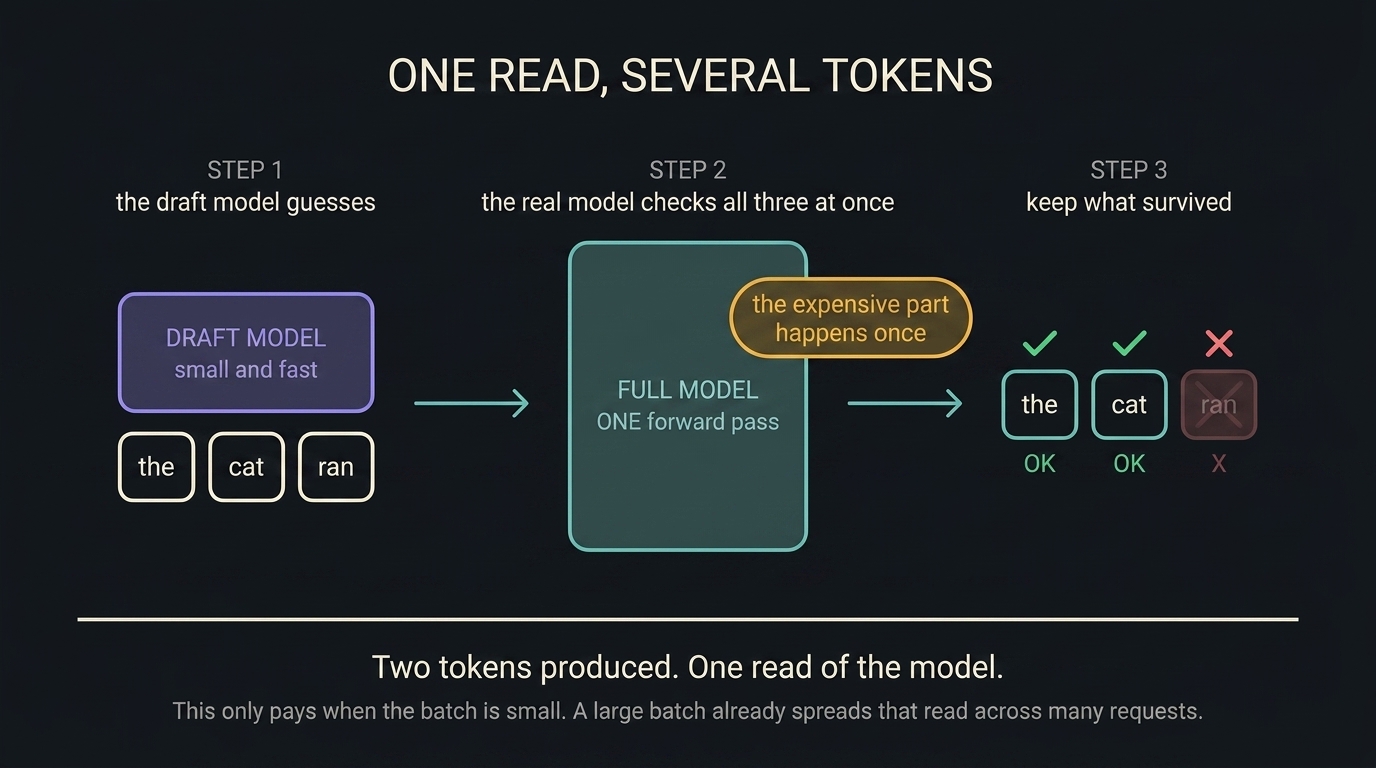
These are the two knobs I spent that night measuring. Measuring them carefully is exactly why I thought I understood my setup.
I upgraded the engine for an unrelated reason
First I did the disciplined thing. One variable at a time, every configuration confirmed by a second run, speculative decoding measured on and off at 63.1 to 112.0 tok/s. Clean, repeatable, and I was pleased with it.
Then a different model I wanted to try. Its architecture was not registered in the version I had. So I built a second environment alongside the first and, while it was sitting there, re-ran the identical benchmark on it.
Same model. Same quantization. Same speculative config. Same memory utilization. Same hardware. Same harness script.
112.0 to 160.0 tok/s
419,200 to 1,574,379 tokens
The variable I never tested moved more than everything I did.
The most important number is the one that did not move
Prefill was 6,266 tok/s before and 6,249 after. Unchanged. That is not a footnote, it is the whole attribution.
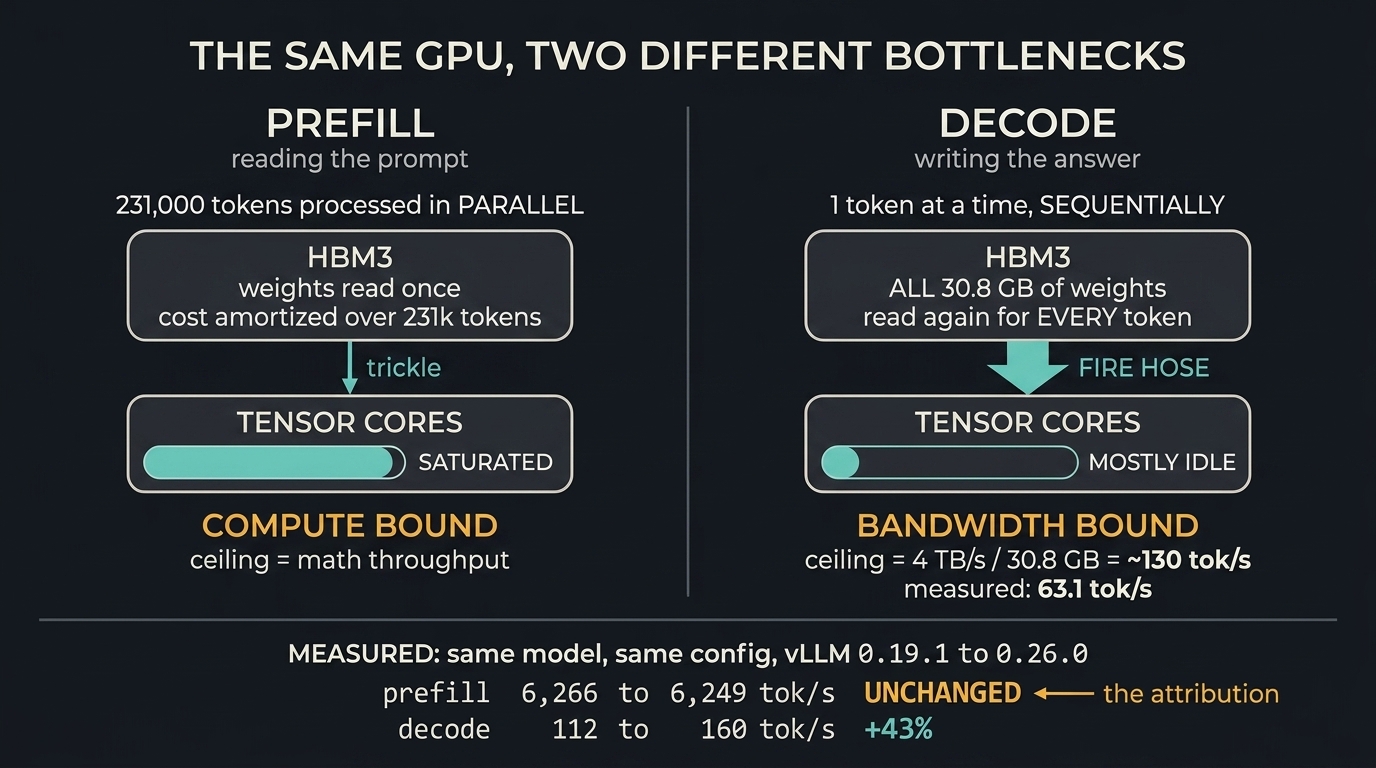
If both had moved I would be hunting a config mistake in my own setup. Because only the bandwidth-bound half moved, I can point at the serving stack. A null result did the attribution.
A config field I had never once looked at
"full_attention_interval": 4
This model is not a uniform stack. One layer in four is ordinary full attention; the other three are not.
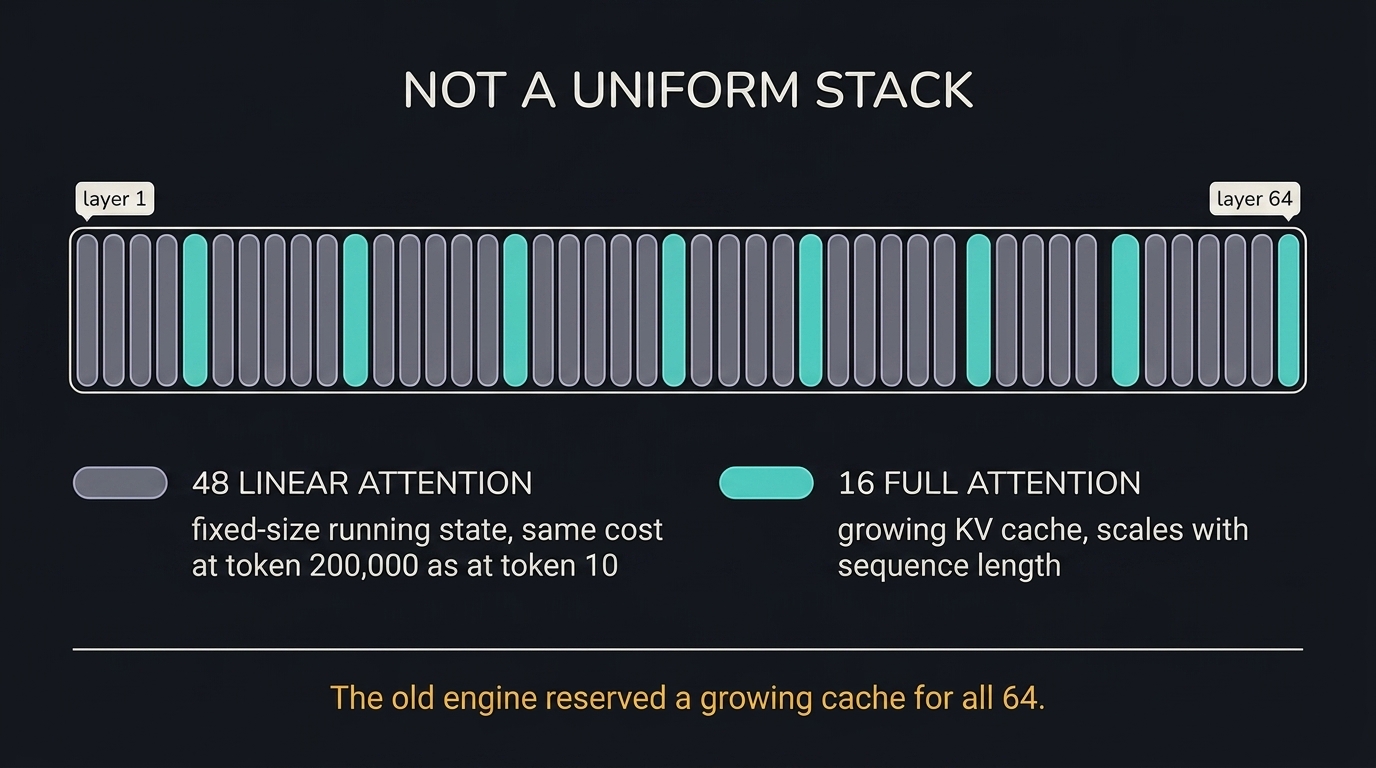
This is the second way the architecture cuts your context bill. The first was sharing key and value sets across heads; this one skips three quarters of the layers entirely. The older engine did not know that. The ratio predicts 4x; I measured 3.75x. Inferred from release notes and that ratio, not from per-layer cache logs.
Nothing errored. Nothing warned.
- It answered correctly
- It passed needle retrieval at 231,000 tokens
- It drove a working agent loop for weeks
I just had three quarters less context than I thought I did.
This is the shape of the whole talk. The loud failure is the easy one: the model refuses to load, you go find a newer engine, you move on with your day. The quiet failure is the expensive one.
"This model is chatty and incompetent at tools"
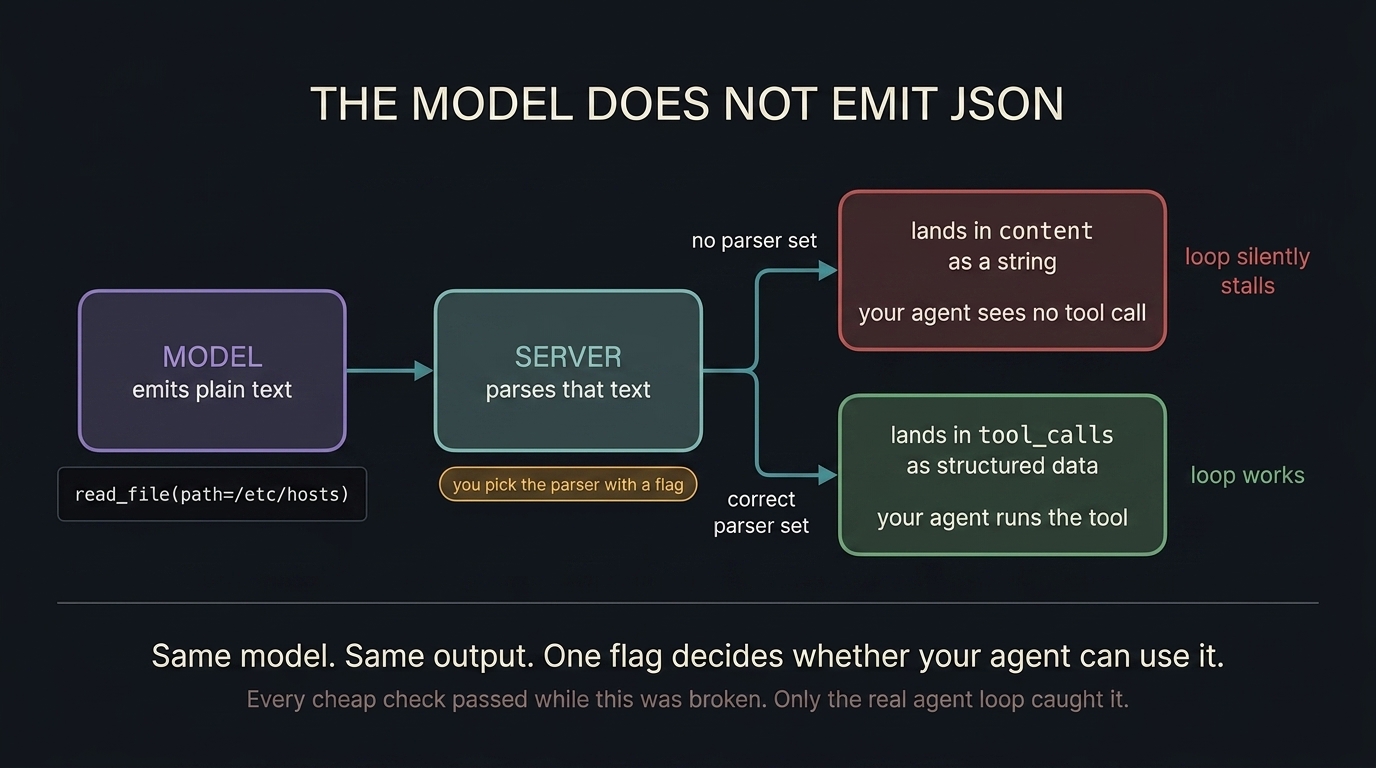
Every cheap check passed while this was broken. Models endpoint: fine. Chat completion: fine. Plain prompt: fine. Only running the actual agent loop caught it.
Every one was first filed against a model
- looked like the model fails long-context retrieval was my output cap
- looked like the model is bad at tools was a missing parser flag
- looked like model A's numbers was model B answering silently
- looked like a small context window was a flag with two meanings
- looked like the model cannot be terse was an unbounded reasoning budget
- looked like a memory-placement law was one machine's topology
- looked like the model's context budget was the engine not knowing its architecture
Three of the first four would have been written down as findings about the model rather than about the harness.
Then my own instruments lied to me
Two quote characters. opencode run wraps your prompt in literal double quotes before it goes on the wire. That moved my complexity classifier's margin from -0.155 to -0.085, across the routing boundary, on a scale whose entire range is about 0.2. I had been scoring that classifier against bare strings, a wire format no real client sends. Measured honestly across both, accuracy was 75 percent, not 90.
My cache-busting was cached. Laptop against GH200 on a 49,000-token prefill measured 6.0s and 6.5s. Near parity, and wrong. I had salted the end of the message, so the prefix was byte-identical and both machines served it from cache. Salting the system message instead: 169.6s against 7.1s, a 24x gap pointing the other way.
Anyone can blame their tools. Both of these were mine.
It is not a 96 GB GPU. It is three tiers.
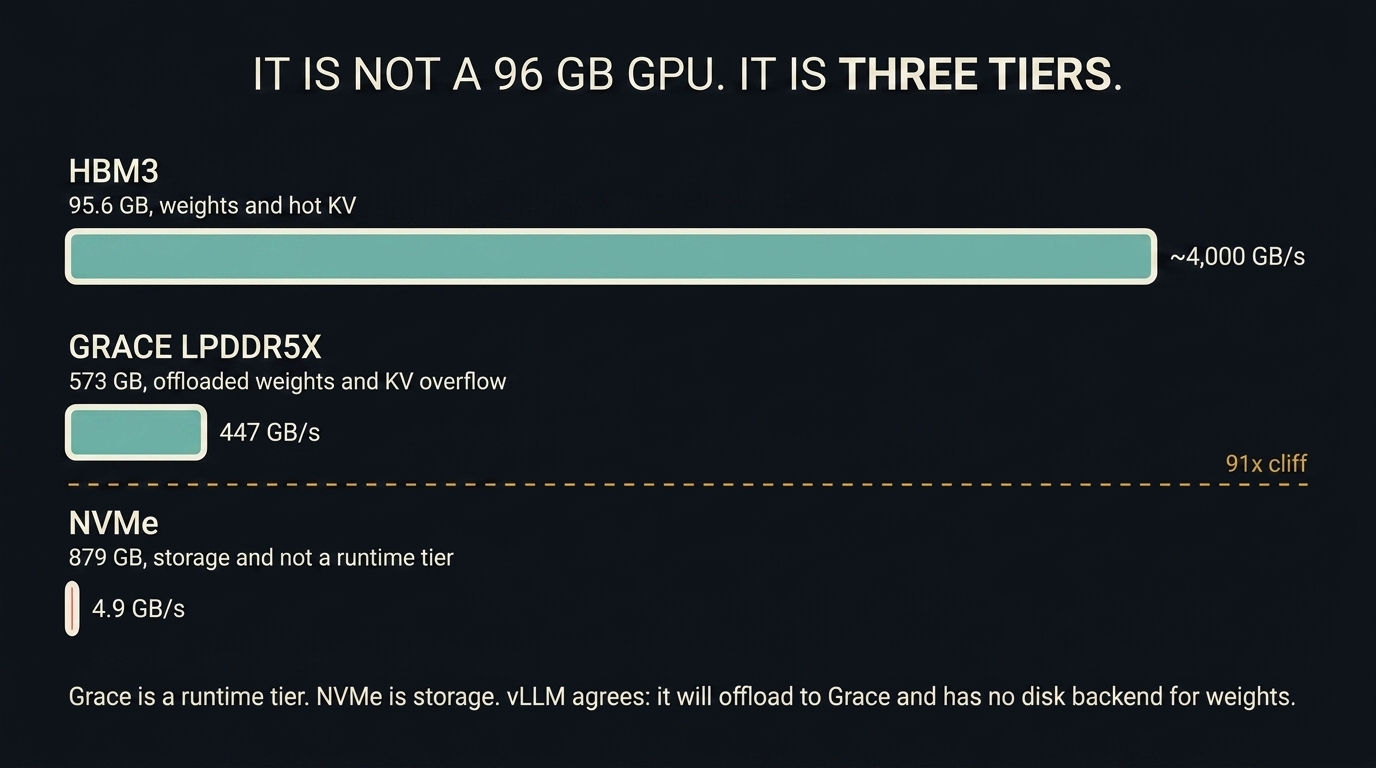
The cliff is between the second and the third, and that one ratio settles nearly every placement question on the box. vLLM agrees with it: offload paths into Grace, and no disk backend for weights at all.
A cache that survives its own eviction
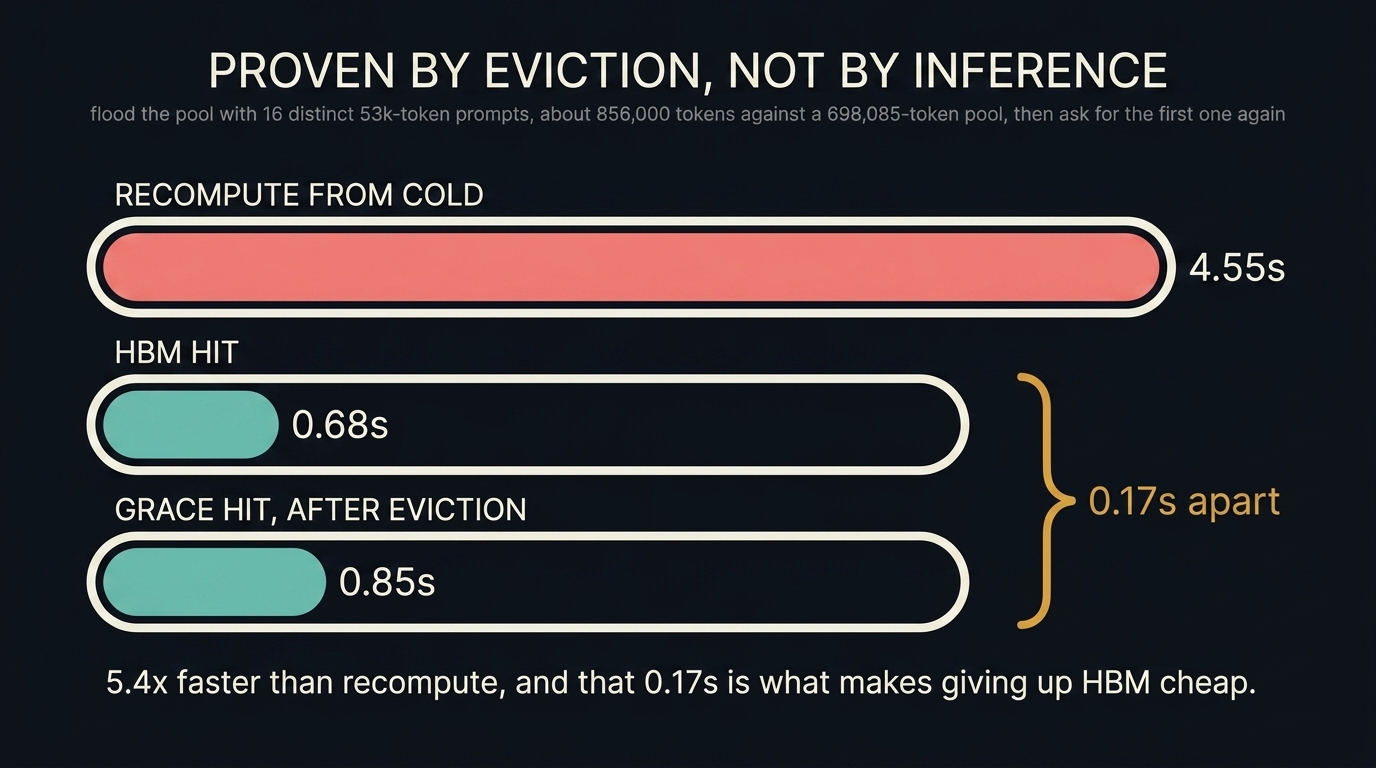
100 GB of Grace behind the HBM pool, proven by eviction rather than by inference. That 0.17s is the entire architecture, because it is what makes giving up HBM cheap.
155.4 GiB of weights on a 95.6 GiB card
--offload-backend uva --cpu-offload-params experts A mixture-of-experts model routes each token to a handful of its experts, so decode touches very few per token. Park those in Grace and the link traffic stays small. And how much you park is not a switch:
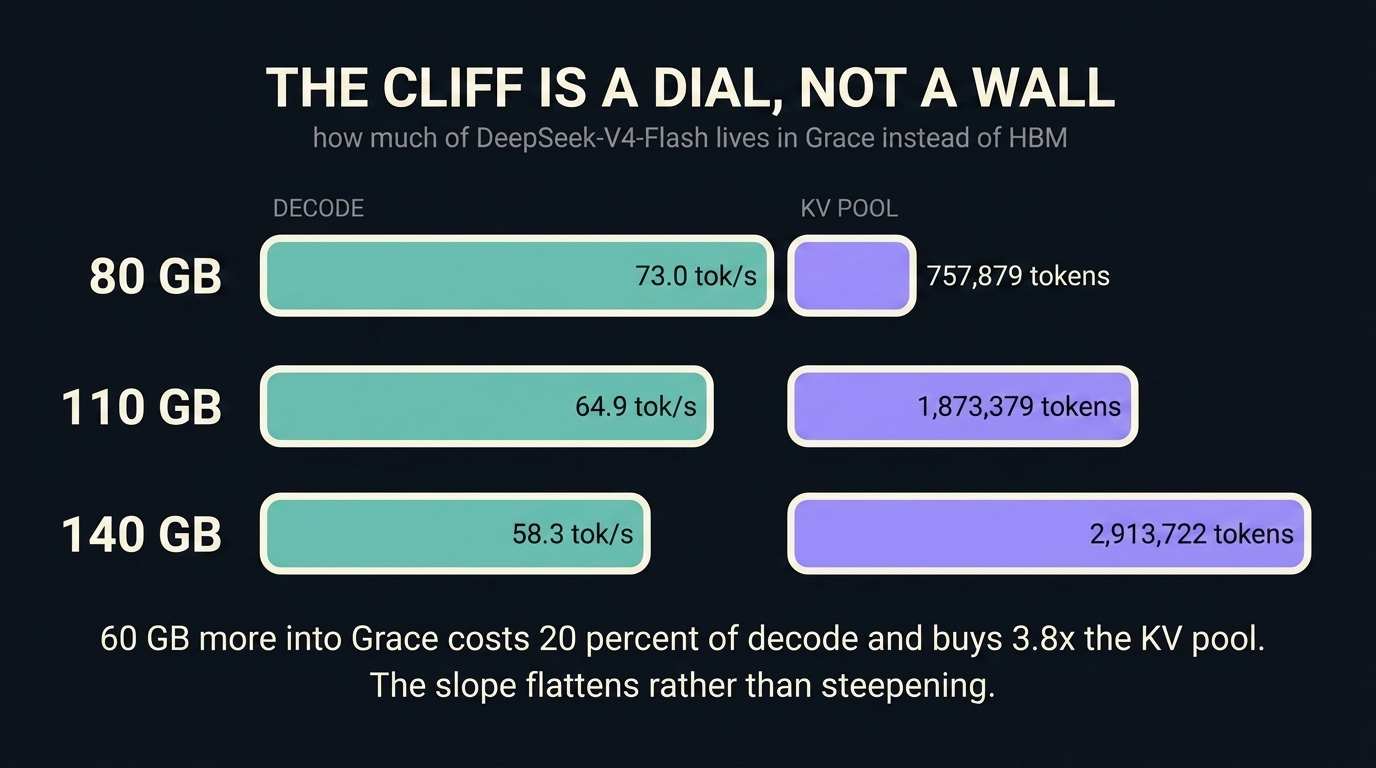
The cliff between HBM and Grace is a dial, not a wall. That is what 447 GB/s looks like when only 6 of 256 experts are touched per token.
Both models fit. It is not free.
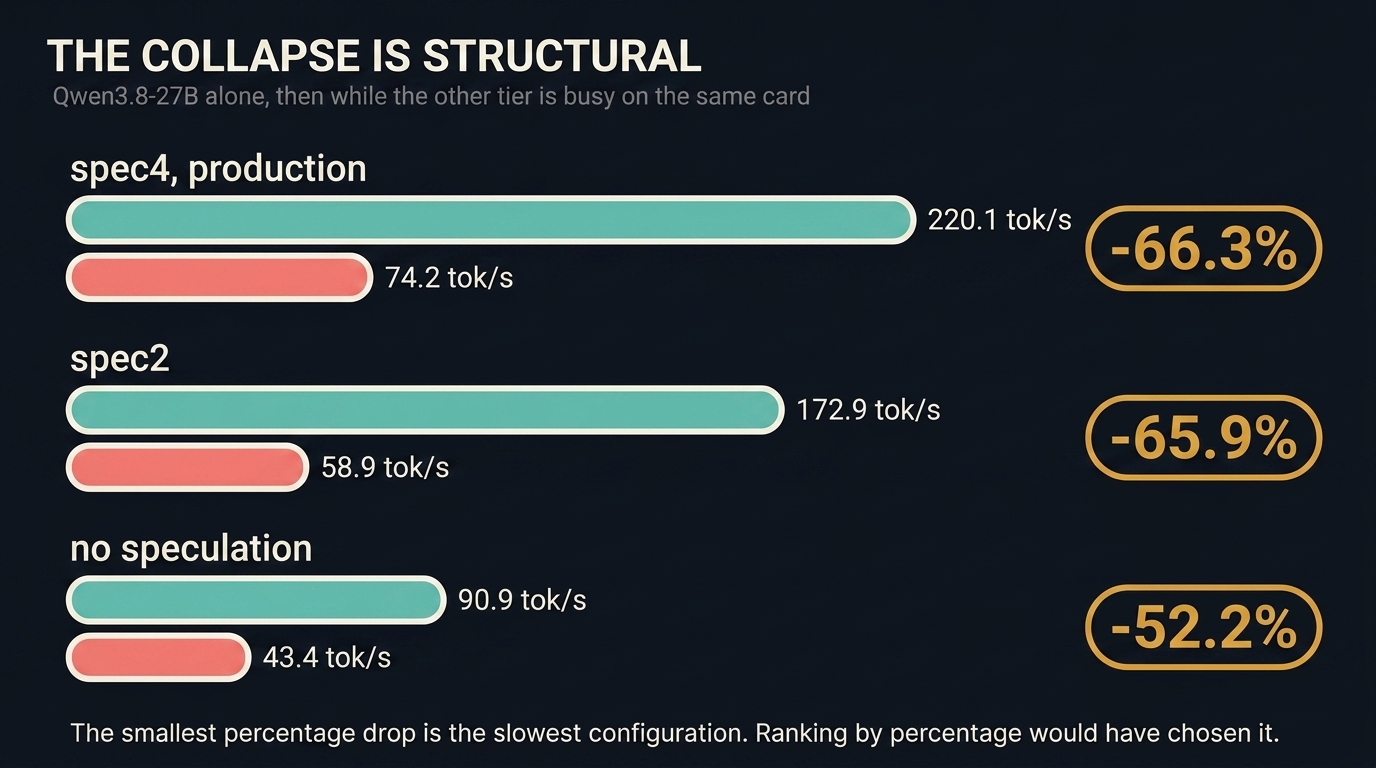
Both fit in 80,642 of 97,871 MiB, and one long-context request in flight costs the tier serving nearly all your traffic about 2.8x. I thought speculative decoding explained that, so I tested it. Turning it off does shrink the proportional drop, and leaves you 1.7x slower exactly when the card is shared. The collapse is structural: a dense model sharing the SMs loses at least half its throughput however it decodes. The MoE does not collapse the same way, but I cannot tell you by how much. Its solo rate swung 40.2 to 57.2 tok/s inside one unrestarted process, so a single sample per condition cannot resolve it.
Three models, and the decode path never noticed
the 27B with the card nearly to itself
matched length, inside run-to-run variance
while Whisper and the vision tier were busy
Two extra tiers and a 2.2x effective KV cache, for nothing on the decode path. The vision tier has since been retired; the 27B is itself multimodal. At matched output length, deliberately: throughput climbs to 262.6 at 800 tokens as fixed overhead amortizes, so comparing across lengths would have shown a gain that was not there.
Worst-case concurrency at a full 262k context falls 5.67x to 2.66x; real agent requests run nearer 50k.
I pointed Claude Code at my own GH200
It speaks the Anthropic Messages API. vLLM serves that API natively. It should have just worked. Four walls, and every one of them was the harness:
- non-canonical field my router's wire struct never declared context_management, which Claude Code sends on every request. I blamed vLLM for weeks. vLLM accepts it fine.
- adaptive reasoning cannot include an effort Claude Code sends adaptive thinking and effort: xhigh together, and Anthropic allows that pair. My router was stricter than the service it stands in for.
- wire format openai.chat.v1 no code fix at all. Point it at an Anthropic-format backend and the lossy translation simply stops happening.
- missing required field stop_sequence vLLM omits a nullable field, so the router killed the stream one event from the end, after the full answer had already reached the user.
48 lines across three files, and it runs against my own card, tool loop and all. The router's original premise did not survive measurement, by the way: the laptop only wins below about 180 prompt tokens and no agent client ever sends that few. One real captured request took 157s locally against 3.0s on the GH200. I built a tier router and shipped a protocol translator.
A backstop changes the price of every trade above it.
The vision tier was unaffordable all session. HBM was full, and dropping the text model's utilization to make room cost KV capacity outright, 1,485,965 tokens down to 698,085.
Once Grace was catching those evictions at 0.17s instead of 4.55s, the same trade became nearly free and the third model fit the same afternoon. Nothing about the machine changed. A constraint I had accepted without re-testing stopped being one.
Any plan you rejected on a constraint is worth re-testing after you relieve something underneath it.
What I actually changed
- Engine version goes on the benchmark axis, not in the environment notes. I record it the way I record quantization, because it behaves like a variable.
- Test the full loop, not the endpoint. Every cheap check passed while tool calling was silently broken. Only the real agent loop caught it.
- One variable at a time, even when it feels slow. Two knobs I tuned partially cancel; flipping both together would have hidden that entirely.
- Re-test your tuning peaks when either the model or the engine moves. Both shifted my optimum by more than 40 percent.
- Checking that a system does what it says is not checking that it is right. That is the one that cost me the most.
Everything you hold fixed is a claim you are making.
A control is an assertion that something does not matter. You rarely go back and check it, because checking it is the same work as testing it, and you already decided it was background.
Somewhere in your stack there is a version number, a default, or an inherited flag you have stopped seeing.
All three of tonight's newest failures were claims I did not know I was making. That the wire format was fixed. That the flag arrived. That my salt busted the cache. That the HBM number was the ceiling.
The background of your benchmark is someone else's independent variable.
Questions, arguments, war stories
Colin McNamara · Field CTO at AHEAD · organizer here at AIMUG.
Full write-up with every measurement, the diagrams, and the parts I got wrong along the way:
colinmcnamara.com/blog/engine-other-half-of-the-model
If you run open-weight models on your own metal, I want to hear which of these six you have already hit.